Consilium Fund Comparison Calculator.
A bespoke tool that enables financial advisers to visually demonstrate the long-term impact of KiwiSaver fund choices, improving decision-making and engagement with clients.
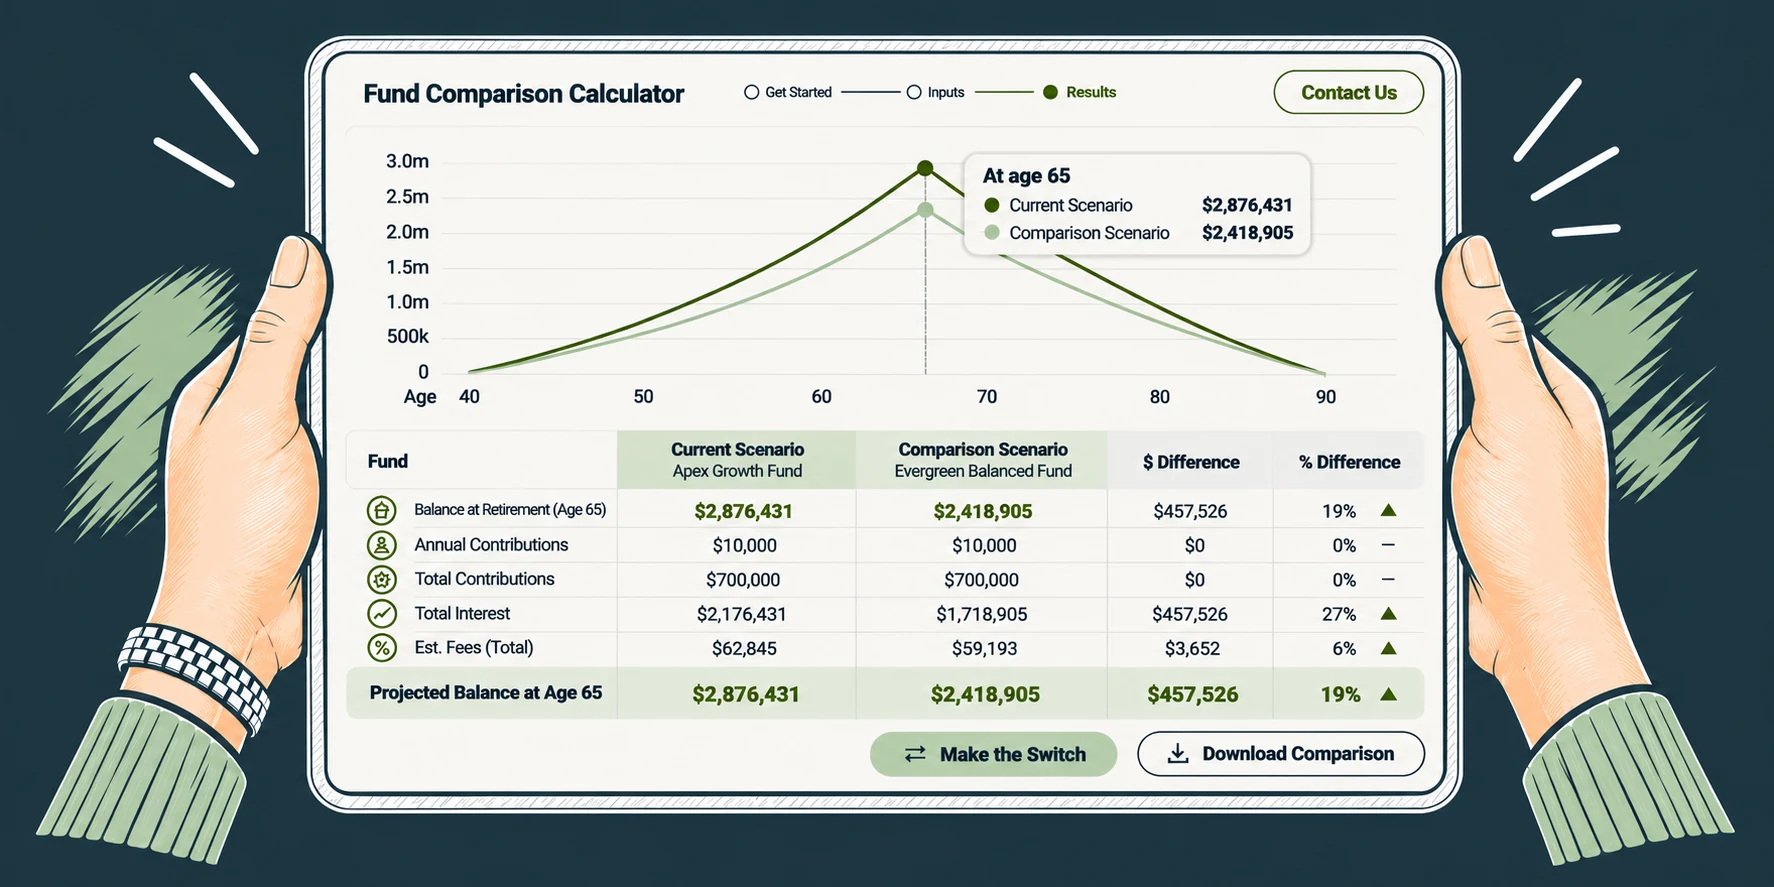
Rebuild a proven Excel tool for digital delivery, scalability and user experience.
A responsive web application embedded in Consilium’s adviser platform.
Delivered on time and on budget, within nine weeks.
A trusted tool that had outgrown its format.
With the launch of a new KiwiSaver scheme on the horizon, Consilium identified an opportunity to modernise a key tool. Originally created in Excel, the calculator had proven its value in conversations with advisers, but it needed to be rebuilt for digital delivery, scalability and user experience.
An Excel tool with proven value
- Side-by-side projections of different investment strategies
- Already valued in conversations with advisers
- Ready to be rebuilt for digital delivery
A digital tool built to last
- Improving usability across devices and adviser workflows
- Enabling brand and role-based customisation (public vs adviser)
- Future-proofing for evolving product models
- Integration into the Consilium Adviser Portal
“The systems advisers rely on don't need replacing. Our work is the layer on top: the part that turns a long-term decision into something you can see and act on.”
We started by understanding, not building.
This was the first time the Consilium and GCD teams had worked together. A shared vision, a structured approach and a strong communication rhythm kept the project moving smoothly.
Stakeholder workshops
Aligning the Consilium and GCD teams around a shared vision.
Clear milestones
A fixed-price basis with clearly defined milestones gave the whole team visibility over progress and deliverables.
Compliance in parallel
Consilium could keep refining the underlying Excel logic, so internal compliance testing did not slow the build.
Nine-week delivery
A time-sensitive window, aligned to Consilium’s product launch timeline.
Built to sit inside Consilium’s adviser ecosystem.
The application is embeddable via iframe into Consilium’s existing adviser platform and maintains compatibility with their hosting and security requirements. It can be tested independently, and its modular structure allows rapid iteration and future enhancements.
Designed around the conversation, not the spreadsheet.
One application, two views. Advisers run personalised investment projections for clients and visually compare retirement outcomes based on fund selection and key input changes, alongside a public view with secure role-based access.
Consilium’s brand
Brand and role-based customisation across public and adviser views.
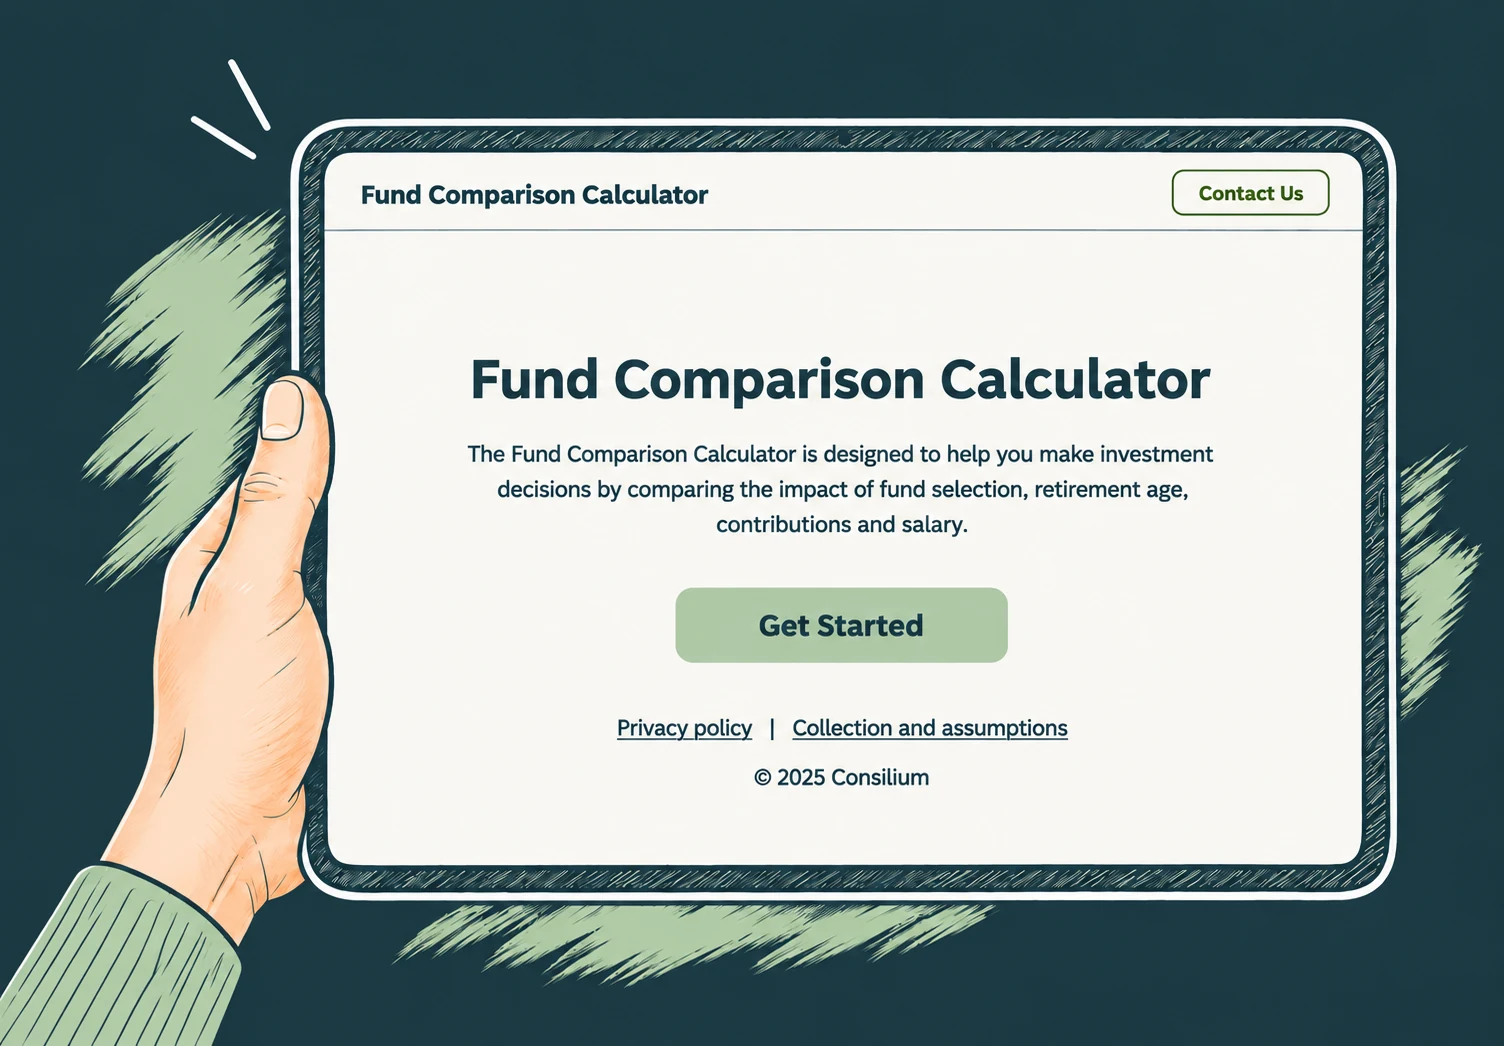
One tap into a guided flow
“Get Started” opens the comparison journey.
Across devices
A fully responsive application tailored for enterprise deployment.
Lead the client conversation
- Sign in for role-based access
- Personalise projections to the client
- Present balance, drawdown and total spend visually
Compare outcomes visually
- Start from smart defaults
- Adjust editable assumptions
- Compare outcomes side by side
The product, where the value is.
A rich, visual foundation for adviser-client conversations about a long-term decision.
Interactive charts
Visualising retirement outcomes: balance, drawdown and total spend.
Data input panels
Smart defaults and editable assumptions.
Public and adviser views
Secure role-based access, with views segmented by user role.
Embedded delivery
Embeddable via iframe into Consilium’s existing adviser platform.
Modular structure
Built for rapid iteration and future enhancements.
Built for enterprise deployment.
A fully responsive, full-stack web application that delivers dynamic visual projections while maintaining compatibility with Consilium’s hosting and security requirements.
Frontend
React and TypeScript, with custom chart components.
Backend
Node.js architecture for secure hosting and flexibility.
Deployment
Independently testable and embeddable.
Access control
Views segmented by user role.
Technology React · Next.js · TypeScript · Node.js
A rich, visual foundation for more impactful adviser-client conversations.
The project was delivered on time and on budget, with the full web application completed within nine weeks.
What it enables
- Real-time comparison of fund performance and retirement outcomes
- Adviser tools that support advice delivery without added friction
- A modern user experience that builds confidence and supports client uptake
- A scalable platform for further KiwiSaver and investment modelling tools
Building something similar?
Whether you're modernising an adviser platform, improving investor experience or replacing fragmented internal tools, every successful transformation starts with understanding the business problem before choosing the technology.
Architecture-led · Integration-ready · NDA on request